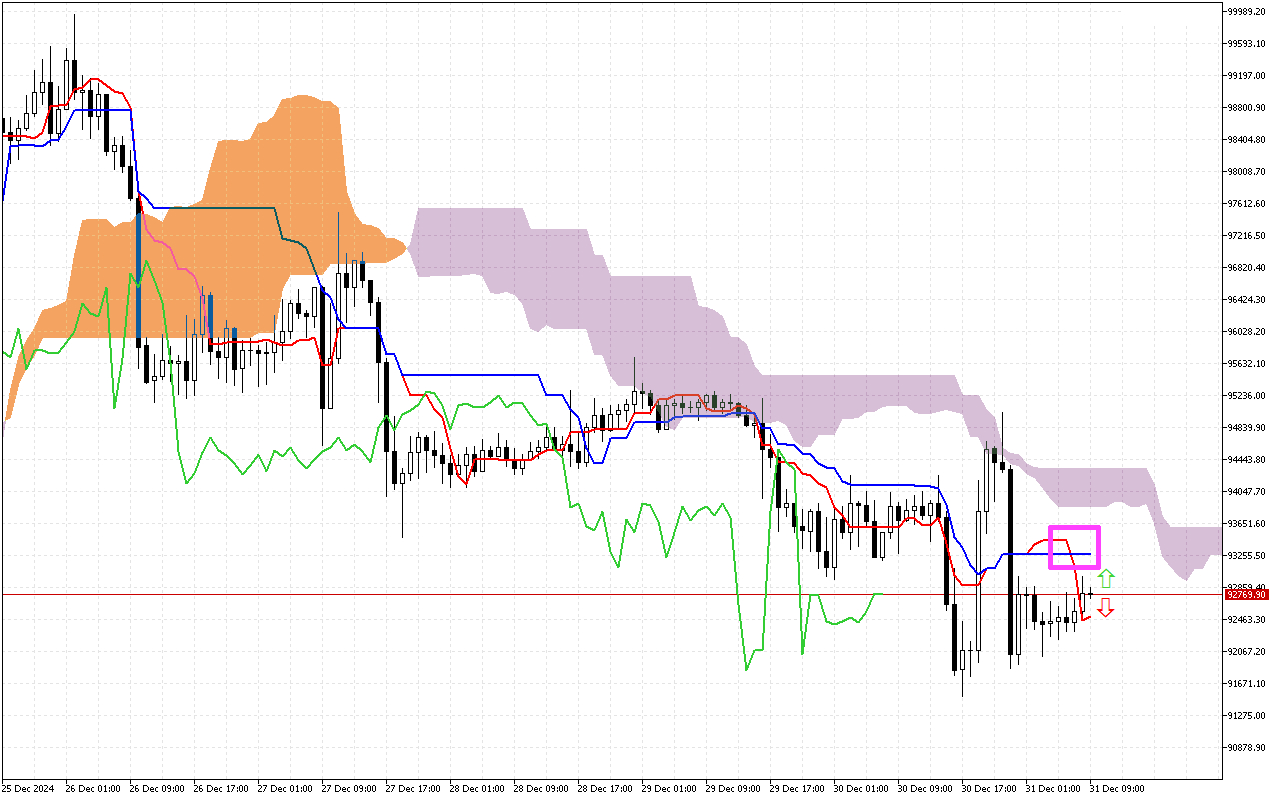
Bitcoin H1: The Ichimoku Forecast for the European Session at 31.12.2024
The current situation:
Let's carefully look at the current values of the main components of the Ichimoku indicator to assess the current state of the market:
The price is currently above the Tenkan and the Kijun lines. It indicates a temporary slowdown in movement and a potential price consolidation.
Now the Kumo cloud is tinted lilac, which indicates a possible change in price dynamics in a negative direction.
In the current market profile, the price has fixed below the Kumo cloud. The boundaries of the cloud form a dynamic resistance zone for the price.
Used by investors to identify a change in trend, the green Chinkou line is held below the price on the chart.
Trading recommendations:
The dynamic support level is on the Tenkan line, around the 92449.75 mark.
Dynamic resistance levels are located on the Kijun line, near the 93264.20, the SenkouA line, at the 93862.45 mark, and the SenkouB line, near the 94330.85 mark.
The main Ichimoku system indicators prioritize searching for entry points into short positions, on a price rollback to the resistance levels.

