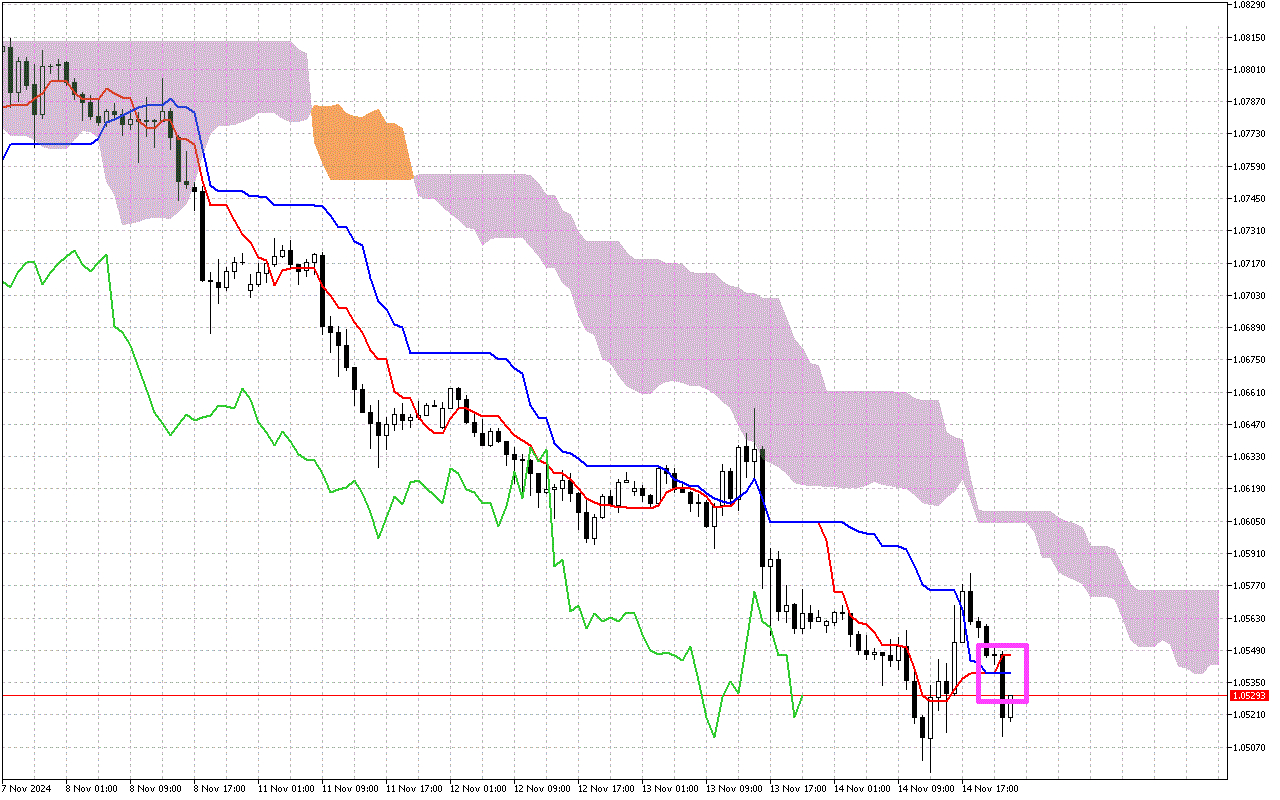
EURUSD H1: The Ichimoku Forecast for the Asian Session on 15.11.2024
The current situation:
Let's look at the main components of the indicator and their current values:
The Tenkan line remains above the Kijun line, but the price has fallen below these lines and is now holding below them.
The Kumo cloud is colored lilac. It indicates the priority of the downward vector of price movement.
The price is below the Kumo cloud, which is now acting as a resistance area for the price.
Trading recommendations:
The dynamic support level is on the Kijun line, around the 1.05391 mark.
Dynamic resistance levels are on the Tenkan line, around the 1.05469, the SenkouA line, at the 1.06046, and the SenkouB line, near the 1.06092.

