Fundamental analysis of XAU/USD
Economic developments at a glance:
U.S.: The U.S. Federal Reserve (Fed) has confirmed that inflation in the country continues to rise, with the 2% target seemingly out of reach. The Fed will have a hard time finding arguments to pause in June. Naturally, an aggressive monetary policy will strengthen the currency, but there are significant risks to the U.S. economy in various sectors.
Precious metals market: Amid rising inflationary expectations, investors are increasingly turning to gold as a defensive asset. At the same time recent growth in gold prices raised concerns about possible market overheating, but in the current macroeconomic and geopolitical realities Investizo believes that precious metals market has a high potential for growth.
Influence of macroeconomic statistics:
The key macroeconomic publication on Tuesday is the release of the US Consumer Price Index at 15:30 (GMT+3). As the Fed's monetary policy meeting is scheduled for tomorrow, inflation data becomes extremely important. Investizo expects a surge of volatility and recommends caution before and during the release.
Technical analysis and scenarios:
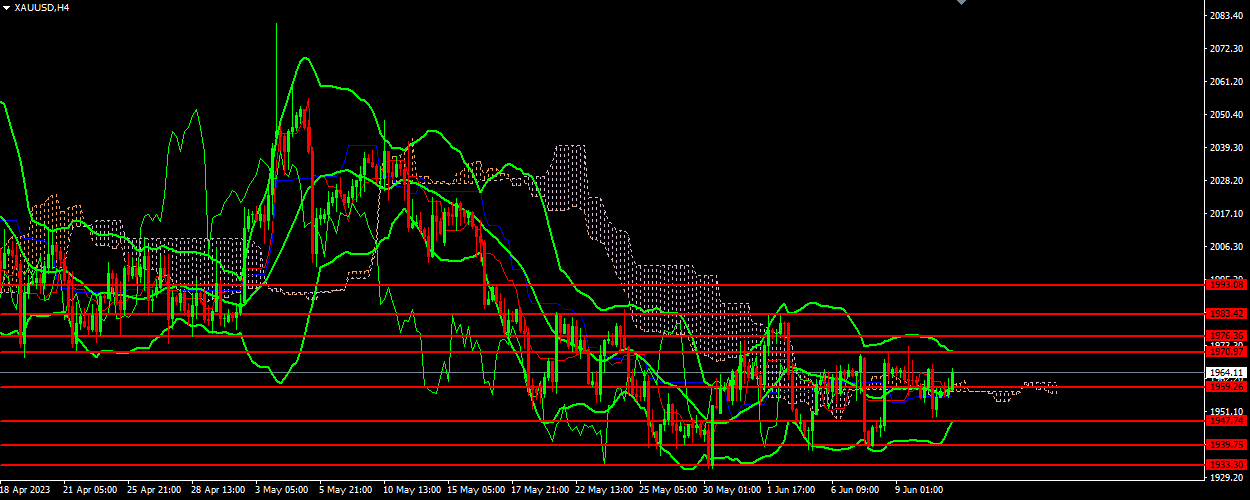
Tenkan-sen and Kijun-sen: Tenkan-sen is above Kijun-sen and both lines are horizontal. This indicates a possible strengthening of the uptrend.
Chikou span: Chikou span crosses the price chart from the bottom to the top, which also indicates a possible strengthening of the uptrend.
Cloud (Kumo): The boundaries of the cloud have merged, indicating uncertainty in the market.
Support levels: 1933.30, 1939.75, 1947.74, 1959.20
Resistance levels: 1970.95, 1976.35, 1983.40, 1993.00
Main scenario: Given the current situation, the main scenario assumes the continuation of the uptrend. Buying can be considered from the current level with a target at the next resistance level of 1980.70. Stop loss can be placed below the support level of 1953.60.
Alternative scenario: If the price falls below the support level of 1959.20, it may indicate the beginning of a downtrend. In this case, selling could be considered with a target at the next support level of 1947.74. A stop loss could be placed above the resistance level of 1970.95.